A Property Comparison of Commercially Available Sillimanite Materials
Steven Ashlock
Kyanite Mining Corporation
Dillwyn, VA, USA
ABSTRACT
The sillimanite group of minerals have long been key materials in the refractory industry. These aluminosilicate minerals share several properties that can be utilized in the fabrication of higher end refractories such as high usage temperatures, excellent creep resistance, thermal shock resistance, high hot strength, and the conversion to mullite at temperature. Andalusite, kyanite, and sillimanite have unique crystal structures despite having the same chemical composition, Al2SiO5. It is these differences in crystal structure that give these minerals their own sets of unique properties. These differences are often misunderstood or not considered. This paper focuses primarily on the property differences shown by each of these minerals due to crystal structure. Differences in specific gravity and particle shape, have been examined along with percentage of expansion upon mullite conversion, mullite conversion temperature, and mineralogy after conversion. Samples of commercially available kyanite, andalusite, and sillimanite have been obtained for comparison. While the differences between minerals of the group are important to understand, it is also critical to understand that you may not be able to replace a mineral from one location with another without difficulty. The origin of these materials is crucial in understanding the property variances. Mining and purification practices vary from locality and will have a drastic effect on the properties of the material and effect on performance of the refractory body. Factors such as purified particle size and impurity level play a vital role in distinguishing one mineral source from another. Chemistry and mineralogical comparisons have been made to distinguish one locality from another.
INTRODUCTION
Raw materials with a high alumina content are commercially important to the production of refractories. With a medium high percentage of alumina (roughly 60-70%), the sillimanite group of minerals have been a staple of the refractory raw materials industry for many years. The sillimanite group of minerals consists of kyanite, andalusite, sillimanite, mullite, topaz, and dumortierite. [1] This paper will only discuss the commercially important (for refractories) mineable minerals of the family: kyanite, andalusite, and sillimanite. Topaz and dumortierite are not considered for use in the refractory industry as they contain boron and fluorine. These elements are lost when heated which can have negative effects on the refractory body. [1] Mullite is found very rarely in nature and thus is not mined in it’s pure form. Mullite on the market today is made by combining and calcining high alumina clays or by phase transformation of sillimanite minerals to mullite via calcination. Although considered a raw material by many, this paper will leave it out of the discussion as it is not mined as mullite but must be made from another raw material. Kyanite, sillimanite, and andalusite are polymorphs with the composition Al2SiO5. The varying crystal structures of these three minerals give them their unique properties from each other. The crystal structure is determined at the time of formation. The minerals in the sillimanite group are metamorphically formed aluminosilicate minerals. These minerals are often found in aluminous deposits that have been subducted and metamorphosed. [2] High heat and pressure are applied to the aluminous material and minerals begin to form. They can also be created from volcanic ash and tuft that is deposited, subducted, and metamorphically formed. [2] The pressure and temperature of formation determine the crystal structure that the aluminous material will take. A pressure-temperature phase diagram for formation can be seen in Figure 1. [3] Kyanite is the high pressure phase of the three. This is to be expected as kyanite has the highest density of the three at 3.65 g/ cm3. The high pressure alters the coordination of the alumina and causes crystallization in a triclinic structure. [3] Sillimanite is the high temperature structure and andalusite forms at lower temperatures and pressures. Both crystalize with an orthorhombic structure and similar densities. Sillimanite has a slightly higher density of 3.23 g/cm3 than the 3.16 g/cm3 of andalusite.

All three of these minerals convert irreversibly to mullite when heated. This is an important property for the refractory industry as it allows for in-situ formation of mullite in the refractory object. The temperature of conversion differs between the three minerals due to the differences in crystal structure. Theoretically, kyanite will begin conversion at the lowest temperature with andalusite converting next and sillimanite requiring the highest temperature to convert. This theory will be put to the test in this study. It is also important to note that the speed of the decomposition to mullite increases with increasing temperature. [1] When the sillimanite minerals convert to mullite they undergo a phase transformation. This causes expansion of the crystal as the Al3+ cations change coordination number. Changing the coordination number causes the rearranging of the atoms to form the more open structure of mullite. [3] Kyanite must transform from triclinic to the orthorhombic structure. This leads to the largest amount of expansion of the three minerals at a theoretical expansion of 13.7% volume percent if assuming pure and 100% dense mullite (specific gravity of 3.15 g/cm3). [4] Sillimanite is orthorhombic like the ending mullite phase so the atoms need to move
less than those in kyanite. However, sillimanite still must undergo some movement in the crystal structure which gives it’s conversion the second highest amount of theoretical expansion at 2.5 volume percent. The orthorhombic structure of andalusite has the crystal structure most similar to mullite so very little movement of the atoms is required. This leads to the least amount of expansion at 0.3%. [3] However, this assumes that the mullite made during conversion is 100% dense. When the sillimanite group minerals convert they produce mullite and an excess of amorphous silica in the following reaction:

Combining the specific gravity of the mullite and the amorphous silica gives the end product a specific gravity of approximately 3.03 (using 2.2 g/cm3 for amorphous silica). [4] This leads to the following expansion rates: 17% for kyanite, 6.2% for sillimanite, and 4.1% for andalusite. These expansion rates (and general trends) will be examined with real world materials in this paper.
TESTING PROCEDURES
Firing
Samples of kyanite from the United States, India, and Ukraine were obtained along with sillimanite from India. Two samples of andalusite from France and one from South Africa were also gathered for testing. The author acknowledges that there are other sources of each mineral available but was not able to obtain samples of those materials to include in the study. It is also important to note that the samples were obtained over a period of time so the currently available material may differ slightly than the material tested. In fact, samples of the kyanite from India seemed to vary widely despite coming from the same source. The sample deemed most representative in terms of chemistry and mineral composition of the Indian samples was selected for testing and reporting. 15 grams of the sample was spread thin on a refractory plate to keep the material from insulating itself. The minerals were then fired at a temperature between 1250 and 1700°C at 50°C degree intervals. 1250°C was chosen as the starting temperature as previous work with kyanite, the mineral of the three with the lowest conversion temperature, doesn’t start to convert until 1300°C. [1] All materials were fired at their specific firing temperatures at 10°C per minute with a one hour hold period in an electric box furnace. The furnace was shut off after this hour and allowed to cool naturally. The furnace was calibrated using TempChek tabs before the trials began.
Specific Gravity
Specific gravity tests were done on Micromeritics AccuPyc Helium Pycnometers. An average of three specific gravity values was taken as the specific gravity for each sample. The machines used silicon metal as a check standard. This check standard was recorded after every 4 samples. Recalibration of the machine was performed if the check standard was outside of the limits. When this happened the previous samples (the 4 since the last good check standard) were rerun.
XRF/XRD
X-ray Fluorescence (XRF) was done using the Omnian program on a Panalytical Axios Max. This program is used to identify unknowns by searching for the presence of every element. X-Ray Diffraction (XRD) was done in a Panalytical Cubix3. XRD scans were analyzed by Rietveld Analysis on the Panalytical High- Score program. Both XRF and XRD were run using pressed powder discs.
Imaging
Images were gathered with a DinoLite optical microscope to observe differences in particle shape.
RESULTS AND DISCUSSION
Specific Gravity and Expansion
In order to determine the percent expansion upon firing, the green and post fired specific gravity results of each sample were compared. Those results can be seen below in Table 1. The expansion results are shown in Table 2. These results have been graphed for ease in viewing trends in Figure 2. As indicated in the Procedure section of this paper, 1250°C was chosen as the starting temperature because previous work shows that expansion of kyanite does not begin until 1300°C. All expansion that occurs between the green state and the 1250°C firing is due to expansion of minerals other than the three sillimanite minerals in question. One example of this is the alpha to beta quartz conversion at 573°C. [5] Therefore, the expansion recorded is normalized to the expansion observed at 1250°C in order to more accurately determine the expansion due to the sillimanite minerals themselves.
The green specific gravity results give an indication of the purity of the starting material. Common secondary minerals such as kaolin and quartz both have lower specific gravity values than any of the sillimanite minerals. The inclusion of any number of these minerals will change the specific gravity. For instance, it is very clear that the Indian kyanite is less pure than either the American or Ukrainian kyanite due to it’s much lower value. However, it is also clear that neither the American nor Ukrainian kyanite is pure kyanite as their green specific gravity values are below the theoretical value of 3.65 g/cm3. Similarly it would seem that the andalusite from South Africa contains more impurities than either of the very similar French andalusite samples. Again, it is possible to tell that the andalusite samples must not be pure andalusite as they are below the theoretical value of 3.16 g/cm3. The sillimanite samples seems to be almost entirely sillimanite as is matches or slightly exceeds 3.23 g/cm3.
From the data gathered it is apparent that kyanite has the most expansion of the three minerals. Not only is the expansion of the kyanite larger than either sillimanite or andalusite but it can match the expansion of the other two at much lower temperatures. This feature may be very useful when considering energy input or the amount of the sillimanite mineral needed to get the desired expansion in the brick or monolithic body. Of the kyanite samples, the American kyanite has the greatest expansion. The kyanite from the USA undergoes rapid expansion through the lower temperatures reaching a plateau after 1400°C. Expansion begins again at 1600°C. The expansion in the kyanite samples from India and the Ukraine is very similar throughout the lower temperatures. However, the Ukrainian material does have more expansion (~2.5%) than the Indian at 1700°C. Both plateau at a lower temperature than the American kyanite at 1350°C with expansion beginning again at 1600°C. The Indian kyanite has the lowest expansion of the three. This is not surprising when considering the probable amount of impurities as evidenced by the specific gravity.
On the other end of the spectrum, the sillimanite is very volume stable up to 1600°C. This property could be advantageous in a high end refractory piece that needs expansion at such high usage temperatures. The three andalusite samples have a much more linear expansion over the lower and middle temperature range before reaching a plateau at 1550°C. The French specimens of andalusite have very similar expansion curves with the France 2 sample having a lower overall expansion percentage. The expansion of the South Africansample is comparable to the French samples up to 1450°C.
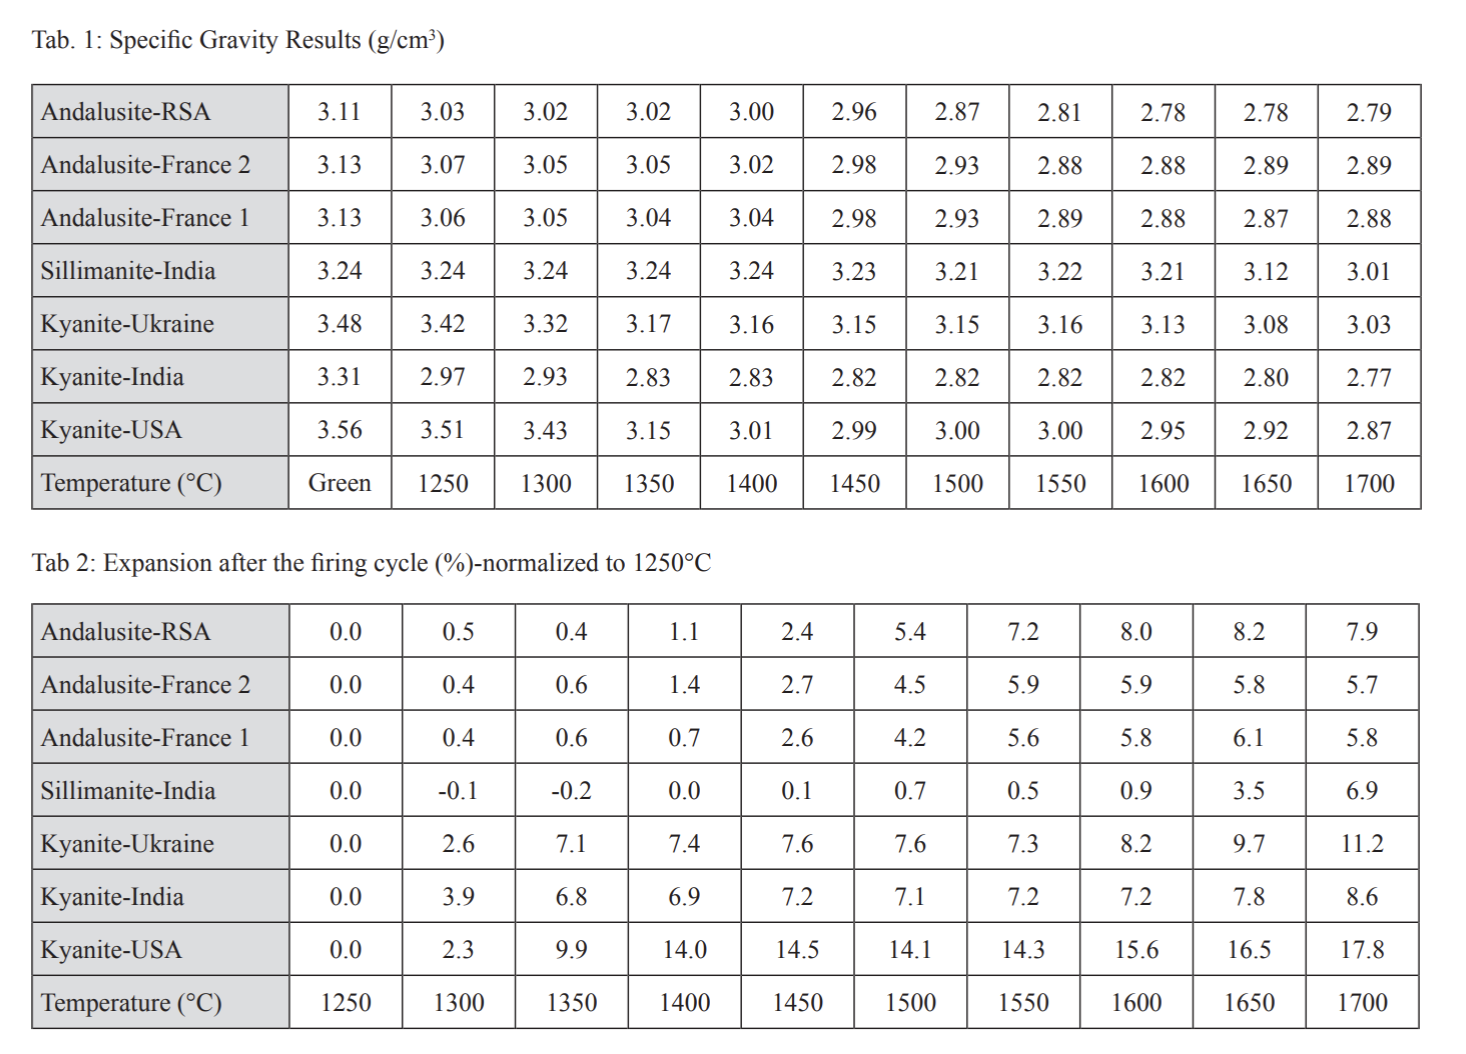

This changes at 1550°C as the expansion begins to accelerate. The progressive expansion characteristics of the andalusite samples seem to lead to a high degree of flexibility in expansion based on firing temperature. However, this expansion is more difficult to pinpoint as there is never a plateau that can be reached. This would make design of the refractory system more difficult and dependent on firing conditions in comparison to reaching an expansion plateu. In the middle of the temperature range where kyanite is at a plateau and sillimanite has yet to expand andalusite could be used to increase expansion in the refractory body. These expansion observations suggest that the mineral of choice to combat shrinkage in a refractory body depend on the firing temperature and the other minerals in the mix. Kyanite should be used for lower temperature expansion (up to 1400°C) where the other minerals present shrink at these lower temperatures. If the other minerals do not shrink more with increasing temperature then kyanite will be sufficient. If the other mix constituents continue to shrink in the 1400-1550°C range then andalusite can be added as it keeps expanding through this range. If the only shrinkage in the mix is at high temperatures (1600°C+) or more expansion is needed once those temperatures are reached, sillimanite will provide the necessary expansion. The temperature of expansion is also important to note for the energy cost when pre-firing a refractory body. As kyanite expands at the lowest temperature and kyanite expands the most the energy cost for expansion will be lower than either of the other minerals.
Chemistry-XRF
Although the minerals may be the same, the impurity level in the samples from different localities varies. These variances can drastically effect the performance of the material in regards to expansion and also overall performance in the refractory body. Even materials from the same source may vary as evidenced by the wide discrepancies seen in the samples from the Indian kyanite product. Initial testing of materials from this source showed variability in both chemistry and mineral composition. The sample with the most representative composition was chosen for testing and reporting in this study. The chemistry results obtained via XRF are shown in Table 3.

The Indian kyanite contains the lowest percent alumina and iron of all of the minerals tested at 50% and 0.24% respectively. This sample also has the highest level of alkali and alkaline earth elements at a combined percentage of 1.75%. The TiO2 level of the Indian kyanite is also lower than either of the other kyanite samples. The Indian kyanite has a substantial amount of F present in the scan that is absent from all of the rest of the samples. The American kyanite and Ukrainian kyanite have a very similar amount of alkalis, alkaline earth elements, and iron. The alumina percentage is lower in the kyanite from the US but both the US and Ukrainian kyanite have a much higher percent alumina than their Indian counterpart. The Ukrainian kyanite also has a large amount of ZrO2 present in the scan. The sillimanite sample is the purest sample of the minerals tested. It has the highest percentage of alumina and, at 62.6%, is close to the theoretical alumina percentage of sillimanite of 62.9%. CaO is the highest impurity aside from Fe2O3 and TiO2. In fact, the sillimanite sample contains the most CaO of all of the samples tested at 0.28%. The percentage of alumina in the andalusite samples from highest to lowest is as follows: France 2, France 1, and South Africa. The South African samples has the lowest level of iron and alkalis of the andalusite samples. France 2 is higher in alumina and also lower in iron than France 1. The combination of lower alumina and higher iron in France 1 when compared to France 2 would indicated a lower max usage temperature as the iron will react with the excess silicon to produce more glass at temperature, leading to higher amounts of creep. All of the other elements are very similar to each other. The alkali/alkaline earth element percentages of all three andalusite samples are higher than the sillimanite and kyanite samples with the exception of the kyanite from India.
Mineralogy and Mullitization-XRD
Mineralogy of the Green Sample X-Ray diffraction (XRD) was used to help fully understand both the expansion percentages and the mullitization temperature of the minerals. XRD also helped identify the other minerals present in the samples. The mineralogy of each starting material can be seen in Table 4. All three kyanite samples contained kyanite and quartz. The accessory minerals and their quantities are what differentiate the minerals. The American kyanite sample contained the most kyanite of the samples at 90.3%. Rutile and pyrite were the major accessory minerals and their concentrations in this sample were higher than the other two kyanite specimens. Unlike the Ukrainian material, which contained 0%, it had a small amount of mica present. However, the amount is significantly less mica than the Indian kyanite sample. '
The Indian kyanite scan shows the presence of several forms of mica, kaolinite, pyrophyllite, diaspore, and a very large amount of topaz. The presence of these minerals can be attributed to the lack of complex beneficiation of this ore body. The high percentage of topaz that is observed explains the high fluorine content seen in the XRF scan. The presence of both pyrophyllite and topaz explain the large amount of expansion that occurs at low temperatures. Large expansion (~10%) in the Indian kyanite was noticed when heating to the normalization temperature of 1250°C. This can be attributed to the secondary minerals in the specimen. Expansion begins with the denaturing of the pyrophyllite at around 515°C. [6]. Topaz will begin to denature to mullite around 1100°C causing expansion and a release of fluorine to the surrounding refractory body. [7] This fluorine will act as a flux in the refractory and lead to lower max usage temperatures. The resulting mullite will act as a seed crystal to begin the mullitization of the kyanite as well. These two factors explain the higher amounts of mullite at low temperatures when compared to the other kyanite samples (Table 5). The diaspore in the scan contributes to the overall alumina percentage and can be seen throughout the test in the post fired scans as corundum.
The Ukrainian kyanite scan shows that the sample is in fact less than half kyanite. The sample actually is close to a 50/50 mixture of kyanite and sillimanite with some zircon present in the sample. This explains why the expansion is less than the other kyanite samples despite higher chemical purity as the sillimanite does not begin to expand until 1600°C. This also explains the greater increase in expansion when compared to the other kyanite samples at the highest temperatures. The expansion in the Ukrainian material is a phase transformation whereas the expansion in the other two is linked to glassification. This material is a byproduct of a beneficiation process for zircon so the presence of zircon is expected.
The sillimanite sample was shown to be very pure in the XRF scans and this is again proven with XRD. The sillimanite was found to be 99.4% sillimanite with the remainder made up of quartz.
All three andalusite samples were found to contain greater than 90% andalusite with the South African samples containing the most other accessory minerals. Mica and ilmenite are common amongst all three samples. Both French samples contain trace concentrations of pyrite that are not seen in the South African sample. The higher amount of quartz, and thus amorphous phase formation, in the South African sample explains the larger expansion when compared to the other andalusite samples.
Mullitization
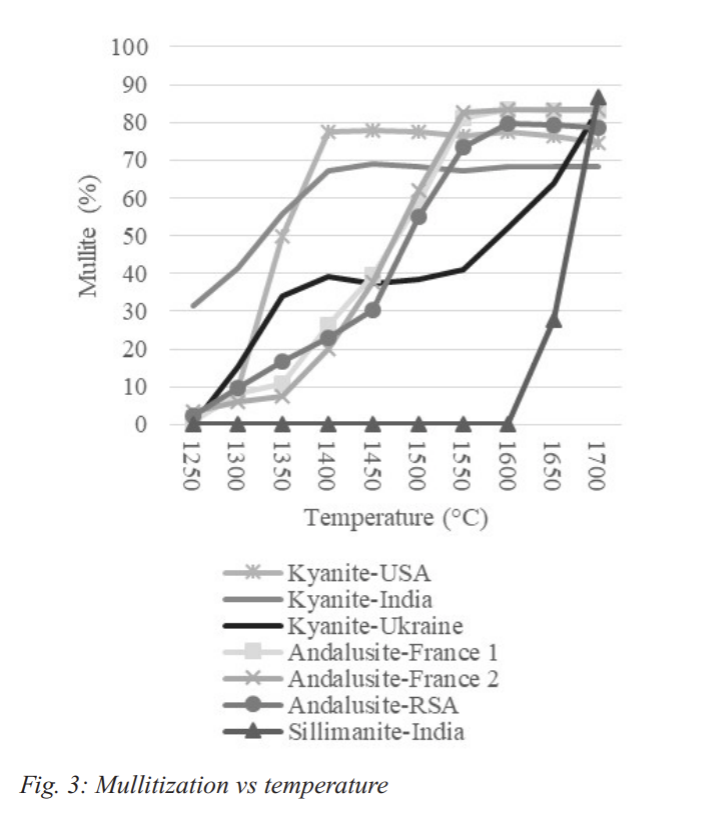
The temperature of mullitization and the resulting amount of mullite are crucial pieces of information needed when designing a refractory body containing one of the sillimanite group minerals. XRD was used to examine the mullite percentage in the sample (Table 5). This data was graphed in Figure 3.
The data shows that the formation of mullite in the two samples containing only kyanite happens at a rapid rate at lower temperatures in comparison to the rest of the minerals. Topaz in the kyanite sample from India has already begun to convert to mullite at 1250°C which explains the high mullite percentage. The rate of mullitization of the American kyanite is much higher than the other two specimens and is only matched (at a much higher temperature) by the sillimanite from India.
The Ukrainian kyanite has a period of rapid mullitization that is then slowed as all of the kyanite has converted. The mullitization resumes when the sillimanite begins to convert at 1550°C.
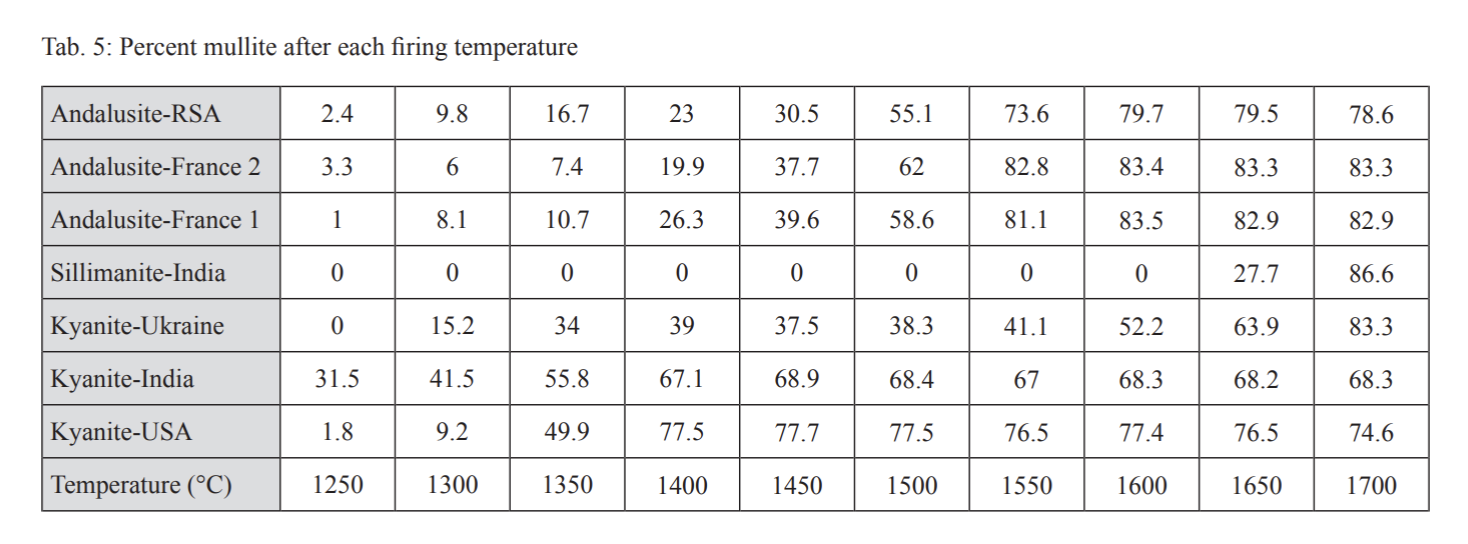
This process begins at a slightly lower temperature than the sillimanite from India. The mullite in the sample that resulted from the conversion of the kyanite acts as a seed crystal for the beginning of mullite formation and lowers the conversion temperature. The three andalusite samples have a similar mullitization curve. The process begins at the lowest temperature for the South African material. However, the South African sample also required the most heat in order to achieve full conversion. French Sample 1 also started mullitization at a lower temperature than Sample 2. The higher iron content may have acted as a flux for this reaction to begin.

Using the above information it was possible to determine the temperature required for 100% conversion of each of the minerals tested. The two fully kyanite samples reached full conversion at 1400°C. The Ukrainian sample converted all of it’s kyanite by 1400°C but it did not fully convert due to the sillimanite present. As with the Indian sillimanite sample, full conversion of the sillimanite took place at 1700°C. All three andalusite samples full converted at 1600°C. These results are shown in Table 6.
Amorphous Content
The amount of amorphous content from the conversion itself should be approximately the same for each of the minerals when in pure form. However, none of the minerals studied are 100% pure. When the quartz in the samples contacts the iron oxides and the alkali and alkaline earth oxides glass will form. The amount of amorphous material present is important to consider as it lowers the overall refractoriness and resistance to creep of the refractory body. The amount of amorphous phase of each sample after firing is shown in Table 7.
As can be expected due to the high level of impurities, the Indian kyanite sample has the highest amount of amorphous phase present as temperature increases. The exact amount of amorphous at the three highest temperatures may actually be higher than reported. At these high temperatures the Indian kyanite sample melted enough to stick to the refractory plate. The material had to be removed with a hammer and chisel. As a result, some of material that was glassy was left behind on the refractory plate in an attempt to avoid contamination from the plate itself. This possibly threw off the amorphous phase percentage in the sample sent to XRD providing lesser amounts of amorphous in the analysis. On the other hand, the Indian sillimanite formed the least amorphous since it was relatively pure both chemically and mineralogically. In general, the kyanite materials will have more amorphous content as they convert at the lowest temperature. As the temperature keeps climbing that amorphous material is able to flux the surrounding material. The less pure South African andalusite has more amorphous material than it’s French counterparts.
Particle Shape and Size

Images taken with an optical microscope show the variation in particle shape between the minerals. The kyanite samples showed the elongated blade-like structure of kyanite. The American kyanite was the easiest sample to show the elongated crystals due to its relatively large size at 435 microns (Figure 4). Of the three kyanite specimens, the American sample is the only one to be found in this large of a particle size. The Indian kyanite sample was harder to image due to interference from the associated minerals as well as the 150 micron average particle size. The Ukrainian kyanite showed some elongated crystals as well as some rectangular and blocky shapes. Particle size of this material was around the 150 micron range. The sillimanite from India had a similar particle size to the Ukrainian kyanite at around 150 microns. A good image of the sillimanite crystals can be seen in Figure 5. The three andalusite samples showed the typical rectangular structure of andalusite. Unlike kyanite and sillimanite, andalusite can be found in a variety of particle sizes. The more blocky structure of the andalusite is a noticeable differentiating factor (Figure 6).

CONCLUSIONS

The expansion and mullitization of the various sillimanite group minerals in this study were examined and compared. Overall, kyanite has been proven to have more expansion that either sillimanite or andalusite. Of the kyanite samples, the American kyanite had the greatest amount of expansion with the Ukrainian sample coming in second. It has less expansion than the American kyanite primarily because the sample was only half kyanite. The other half is made up of sillimanite. The Indian kyanite sample had least expansion of the kyanite samples due to the high impurity levels. The andalusite samples all behaved very similarly in terms of percent expansion with the South African sample expanding the most due to higher impurities and amount of glass formation. Finally, the sillimanite expansion was almost non-existent at the lowest temperatures but matched the expansion of the French andalusite samples at 1700°C.
The chemistry of all seven samples was also examined and used in conjunction with XRD software to determine the minerals present and their amounts. The material with the highest chemical and mineralogical purity level was the sillimanite from India. Of the kyanite samples, the Indian material had the most other associated minerals in the sample alongside the kyanite. This explains the presence of fluorine, alkali, and alkaline earth elements that acted as fluxes to create the largest amount of amorphous material when heated of any of the samples. The American and Ukrainian kyanite samples had similar chemistries with the alumina being slightly less in the kyanite from the US. The alkali and alkaline earth element percentages in these two samples were the lowest of all of the minerals tested. The three andalusite samples had similar chemistries with the South African sample containing the least amount of alumina. Finally, the sillimanite from India was the purest sample of the test and contained enough alumina to indicate it was almost 100% pure.
XRD analysis provided information on the mullite percentage at each firing temperature, the temperature of full conversion, and the amount of amorphous content. Results showed that kyanite converted at the lowest temperature with sillimanite converting at the highest temperature. The amorphous phase present was higher in the kyanite samples than the rest of the tested minerals with the Indian kyanite containing the most amorphous phase. The Ukrainian kyanite was found to be only half kyanite and actually contained roughly 50% sillimanite. XRD analysis showed differences between the andalusite samples, most notably in the higher percentage of amorphous phase formed in the South African sample. In summary, kyanite has the most expansion and that expansion occurs at the lowest temperature. When considering the addition of a sillimanite mineral in a refractory body, using kyanite will provide the highest expansion to energy input ratio. Kyanite will be sufficient unless the refractory body continues to shrink above 1400°C. If this is the case an addition of andalusite or sillimanite may be used depending on the usage temperature. The quality of the material is essential for consistency. A consistent and predictable amount of expansion is key to designing a high performance refractory body. The provenance of the sillimanite mineral must be considered as well as testing shows the same mineral can vary greatly from one source to another.
REFERENCES
[1] Brown, Jesse. Kyanite. Report. Materials Engineering, Virginia Polytechnic Institute and State University. 1982.
[2] Owens, Brent E, and Matthew A Pasek. “Kyanite Quartzites in the Piedmont Province of Virginia: Evidence for a Possible High-Sulfidation System.” Economic Geology, vol. 102, 2007. p. 459–509.
[3] Brandt, Richard C. “The Sillimanite Minerals: Andalusite, Kyanite, and Sillimanite.” Ceramic and Glass Materials Structure, Properties and Processing. By James F. Shackelford and Robert H. Doremus.: Springer, 2008. p. 41-8.
[4] Lide, David R, editor. “Physical Constants of Inorganic Compounds.” CRC Handbook of Chemistry and Physics Student Edition, 86th ed., Taylor & Francis, 2005. p. 4–85.
[5] Tucker, M. G., et al. “A Detailed Structural Characterization of Quartz on Heating through the α-β Phase Transition.” Mineralogical Magazine, vol. 65, no. 4, Jan. 2001, p. 489– 507.
[6] Soares, Robson de Miranda, et al. “Structural Characterization of Mullites Synthesized by Thermal Decomposition of Topaz.” Materials Research, vol. 10, no. 1, 1 Feb. 2007. p. 75–8.
[7] Scott, B., and T. G. Carruthers. “Hydrothermal Reactions and Crystallographic Relationships Found During the Reactive Hot Pressing of Kaolinites.” Clay Minerals, vol. 8, 11 Nov. 1968. p. 21–8. Fig. 5: Relatively pure sillimanite from India-55x magnification Fig. 6: French andalusite-200x magnification